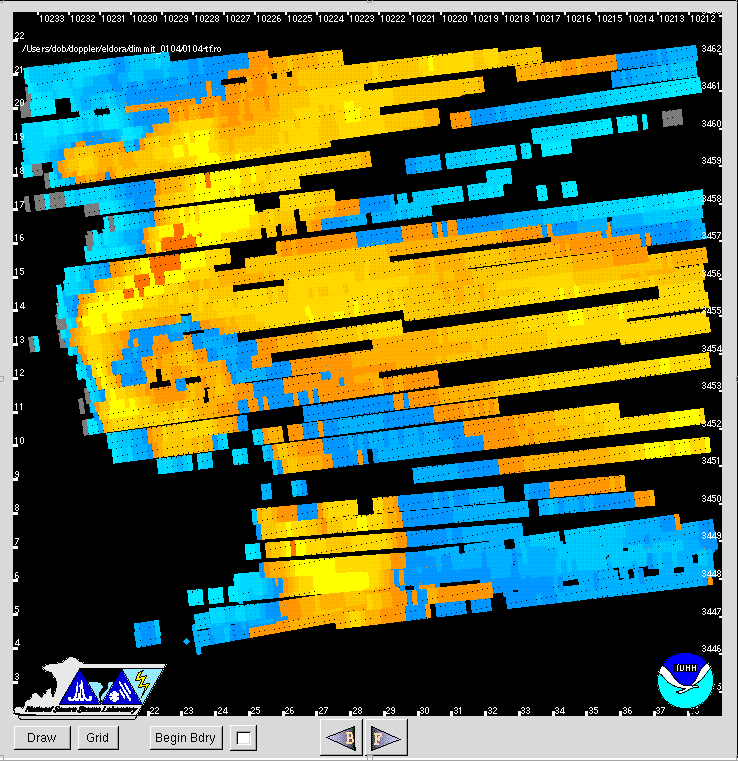
Lubbock, Texas, (LBB) WSR-88D radar. The time is 0100 UTC 03 June 1995; data is from the base tilt. Note especially the large-scale boundary that curves northwestward and intersects the storm. We believe that the intersection of the boundary and the storm may have had a positive effect on the production of low-level vorticity and subsequent spinup of the tornado.Here is a sequence of radar images from the LBB radar (~528K). The QuickTime animation contains 5-minute NIDS data from 0000-0255 UTC 03 June 1995 and shows the evolution of the larger scale environment in which the tornadic thunderstorm developed.
Finally, a satellite loop (~ 5 MB) clearly shows the boundaries that were laid down by earlier convection.
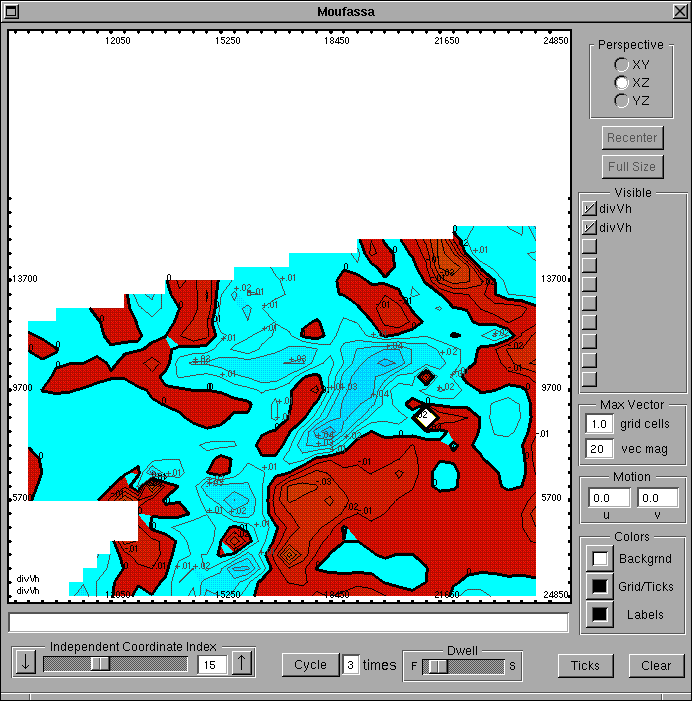
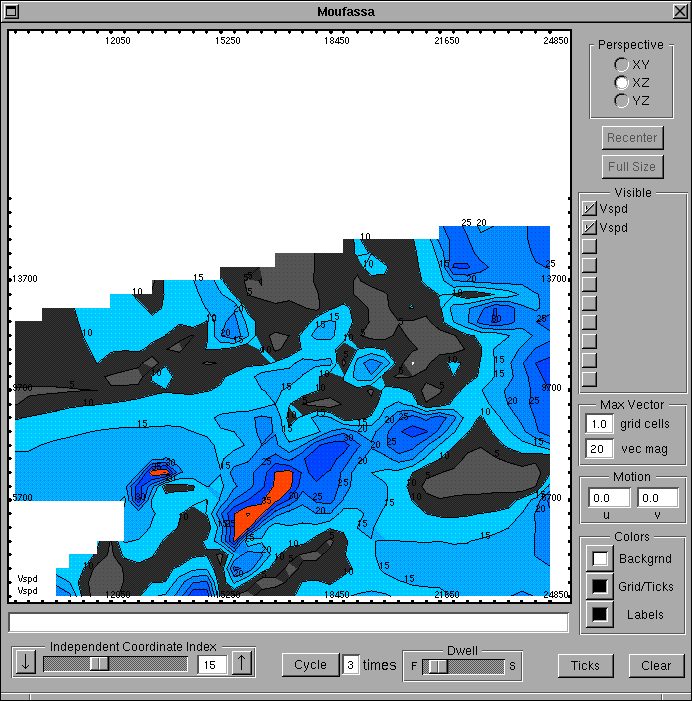
Here we show results of our Doppler analysis of the Dimmitt, Texas tornadic supercell at three times (0052, 0104, and 0111 UTC 03 June 1995). For each time we present a low-level CAPPI of reflectivity and horizontal winds, and cross sections (X-Z plane) of the vertical component of vorticity, and divergence.The grids associated with each time have been constructed so that the origin is located 6 km south and 6 km west of the vorticity maximum at low levels (i.e., at ~2.5 km MSL, or ~1.3 km AGL). The grids are all 40x40x30 in the x, y, and z directions with resolution of 400m x 400m x 500m. The low-level vorticity center is located at grid point [15,15] and the origin is defined as [0,0].
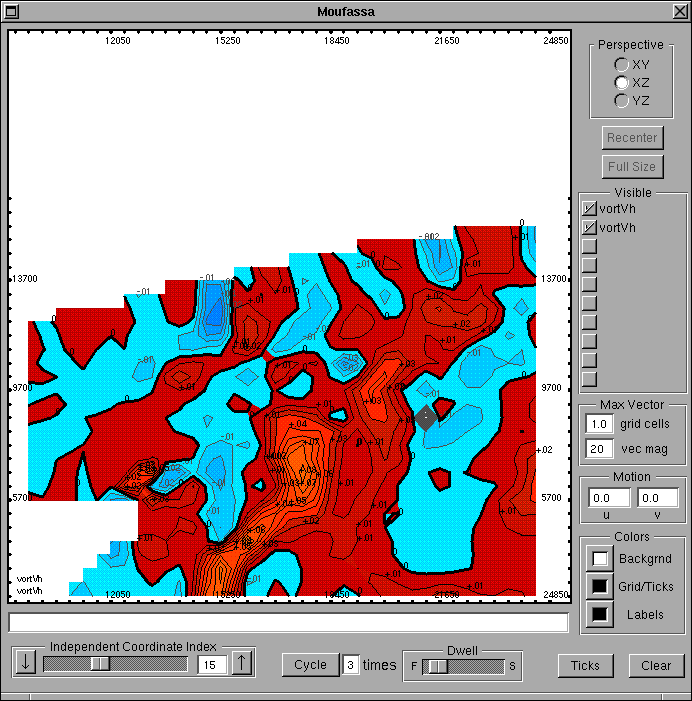
The CAPPI depicts the reflectivity and horizontal winds at 3.2 km MSL (2.0 km AGL). An NW-SE oriented appendage that is part of the developing hook echo is visible near the west edge of the domain. At lower levels, this feature is not yet prominent. A separat e echo is prominent at the southern tip of this appendage. The developing circulation center is located near the junction of the appendage and second cell.A vertical cross section (X-Z plane) of the vertical component of vorticity is presented. Note that the vortex tube is tilted though almost the entire depth of the storm with a short, vertical section extending up to about 3 km MSL.
The divergence cross section indicates that, by and large, the vortex is convergent throughout most of its vertical extent.
The horizontal momentum field is indicative of a region of high momentum in the upper regions and downshear of the vortex. There is some indication of a momentum maximum colocated with the vortex in the lowest kilometer.
The vertical velocity (not shown) indicates that there is a strong updraft associated with the developing hook echo appendage, and a strong downdraft to its west. (Note: vertical velocities still have values that appear to be too large. We are working on a better integration and adjustment scheme to fix this.)
The CAPPI depicts the reflectivity and horizontal winds at 3.2 km MSL (2.0 km AGL). A well-developed, classic hook echo is now evident with a reflectivity minimum at the southeastern tip. The vortex center is co-located with this reflectivity minimum.A vertical cross section (X-Z plane) of the vertical component of vorticity is presented. The vortex is now oriented vertically upwards through about 7.5 km MSL before it tilts downshear.
The divergence cross section indicates that, by and large, the vortex is now divergent throughout most of its vertical extent. The lowest 2 km AGL is still convergent.
The horizontal momentum field now shows that regions of high momemtum extend all the way to the surface. The orientation is vertical through the first few kilometers, then tilts downshear.
Three additional images are presented. The low-level reflectivity clearly shows a "hole" in the tip of the hook, a feature that has been noted in other VORTEX cases. The velocity shows a large mesocyclone and a smaller tornado vortex signature (TVS) embedded in the larger circulation. This RHI of velocity clearly shows the higher velocities associated with the TVS extending upwards to ~5 km.
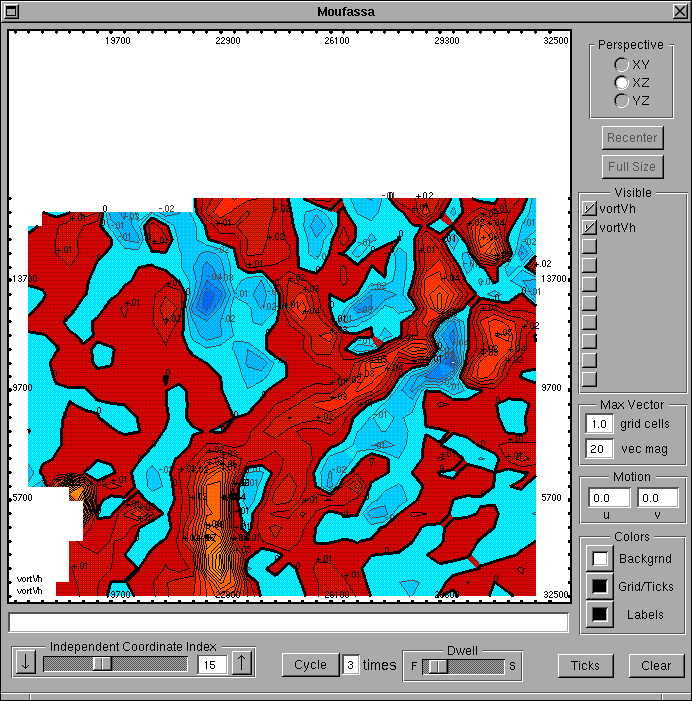
The CAPPI depicts the reflectivity and horizontal winds at 2.2 km MSL (1.0 km AGL). The hook echo that was prominent at the previous time is no longer evident. Instead, we have the vorticity maximum located at the far northwestern tip of the surging gust front.A vertical cross section (X-Z plane) of the vertical component of vorticity indicates that the vortex is once gain tilted downshear through the depth of the storm. Also, the horizontal dimensions of the vortex have expanded significantly since the previous time.
The divergence cross section indicates that the vortex is mostly divergent through its vertical extent. The strongest divergence is located in the lowest few kilometers of the storm.
The horizontal momentum field indicates that there has been a notable weakening throughout the depth of the vortex.
The panels shown above clearly show the tremendous evolution of the hook echo over relatively short time periods. Some of the more intriguing features include:Stay tuned! It can only get more interesting!
- The tilt with height of the vortex, followed by a more upright vortex during the peak of the tornado, then a return to a more tilted vortex.
- The transition from a convergent vortex just prior to tornadogenesis, to a vortex that is divergent aloft and convergent below during the peak of the tornado, followed by a divergent vortex during the final stages of the tornado.
- The appearance of a divergent vortex MAY be the result of hydrometeors and other debris being centrifuged out of the vortex by the strong cyclostrophic flow. If so, it means that we cannot adequately measure the true winds and divergence associated with the vortex. If, on the other hand, the divergence and wind fields do properly measure the vortex, we have some intriguing data to investigate.
The Doppler on Wheels (DOW) is capable of collecting high spatial resolution reflectivity and velocity data near tornadoes. We present two Quicktime animations (reflectivity;velocity) of multiple tilts scans for a single time to show the vertical structure of the storm.This volume scan was collected starting at ~0111 UTC 03 June 1995, which is during the mature phase of the tornado. The distinct hook echo that was clearly evident at earlier times (i.e., 0104 UTC) is no longer visible and the tornadic circulation has moved northeastward into the larger storm core.
 Back to VORTEX Main Page
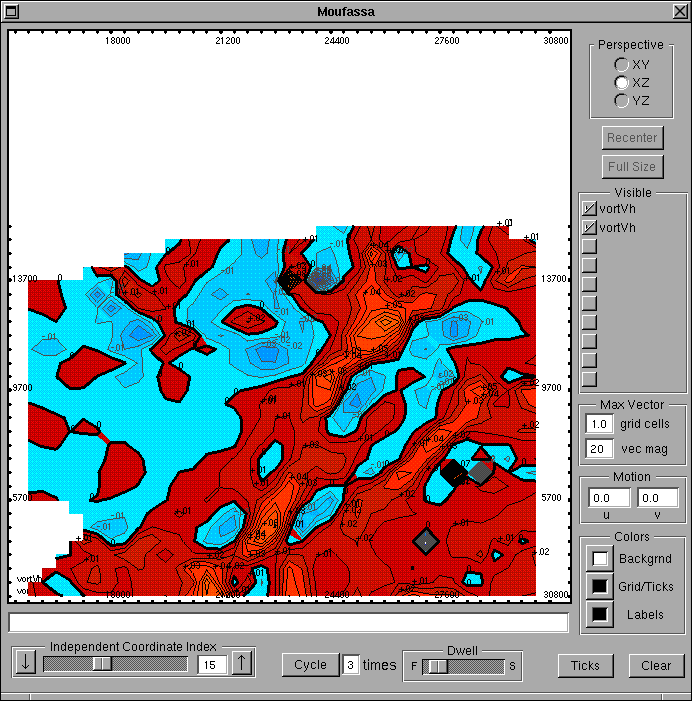